Debugging kie-workbench (a.k.a business-central) is a bit tricky because it’s built on top of Uberfire/Errai/GWT stack. You may notice that your remote debugger sometimes doesn’t stop at break points.
GWT transforms some Java sources into Javascript/HTML so that they can work in browser side. In other words, some Java sources are not actually executed in JVM. Specifically, *.client.* packages (and *.model.* packages when they are accessed by client classes).
Environment: Drools 6.3.0.Final
There are 2 approaches to debug GWT client side:
1. SuperDevMode
If you experienced classic “DevMode” some years ago, you may be surprised that current Google-Chrome / FireFox don’t support the GWT plugin any longer. You cannot debug the GWT client java code in your Eclipse 😦
Now it’s “SuperDevMode”. What “Super” is … you can debug the client Java code in your browser!
You can find more details in Mike’s blog post.
http://blog.athico.com/2014/05/running-drools-wb-with-gwts-superdevmode.html
The blog post explains how to use SuperDevMode via GWT launcher. It’s useful if you are developing kie-workbench but you need to configure the kie-drools-wb-webapp project with GWT Eclipse plugin (sorry, I don’t know about IDEA). There is an easier way if you want to just debug the code.
1. Clone kie-wb-distributions from github (https://github.com/droolsjbpm/kie-wb-distributions) and checkout an expected tag (e.g. 6.3.0.Final).
2. cd kie-drools-wb/kie-drools-wb-webapp
3. mvn clean install -DskipTests Probably, not required, just in case.
4. If you are setting an env variable “JBOSS_HOME”, clear it. (e.g. export JBOSS_HOME=)
5. mvn gwt:debug
Since GWT 2.7.0, SuperDevMode is default. You will see the message:
[INFO] Super Dev Mode starting up
[INFO]    workDir: /tmp/gwt-codeserver-4694758264243958369.tmp
[INFO]    Loading Java files in org.kie.workbench.drools.FastCompiledKIEDroolsWebapp.
[INFO] INFO  [org.jboss.modules] JBoss Modules version 1.3.3.Final
...
[INFO] Listening for transport dt_socket at address: 8000
6. Attach Eclipse remote debugger to the port 8000
7. GWT Development Mode Window pops up.
8. Wait until the GWT Development Mode Window displays “Copy to Clipboard” button. (It takes sometime. Examining the window may help the GUI to refresh)
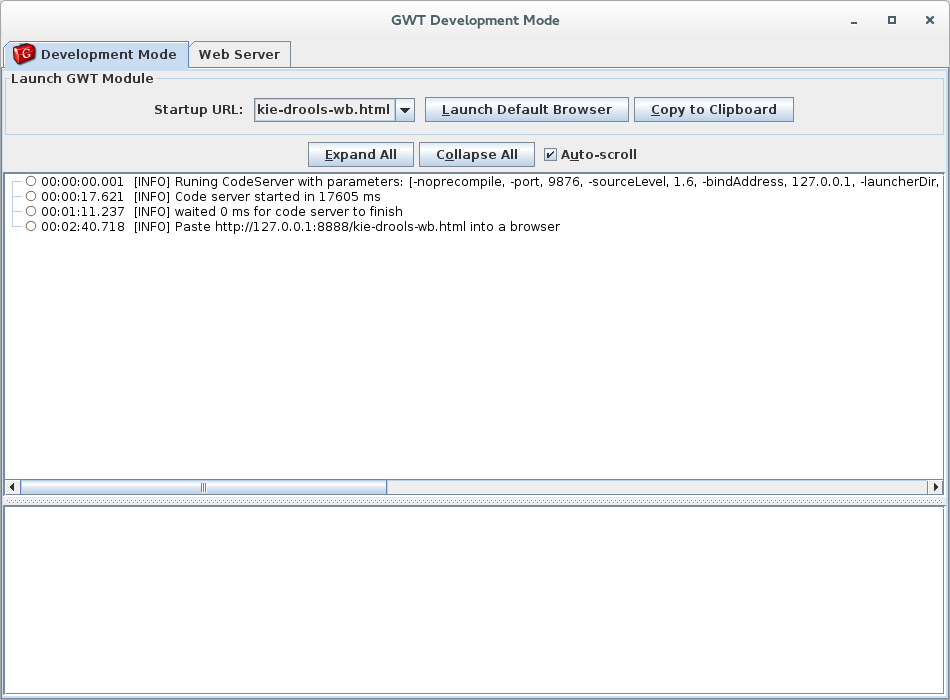
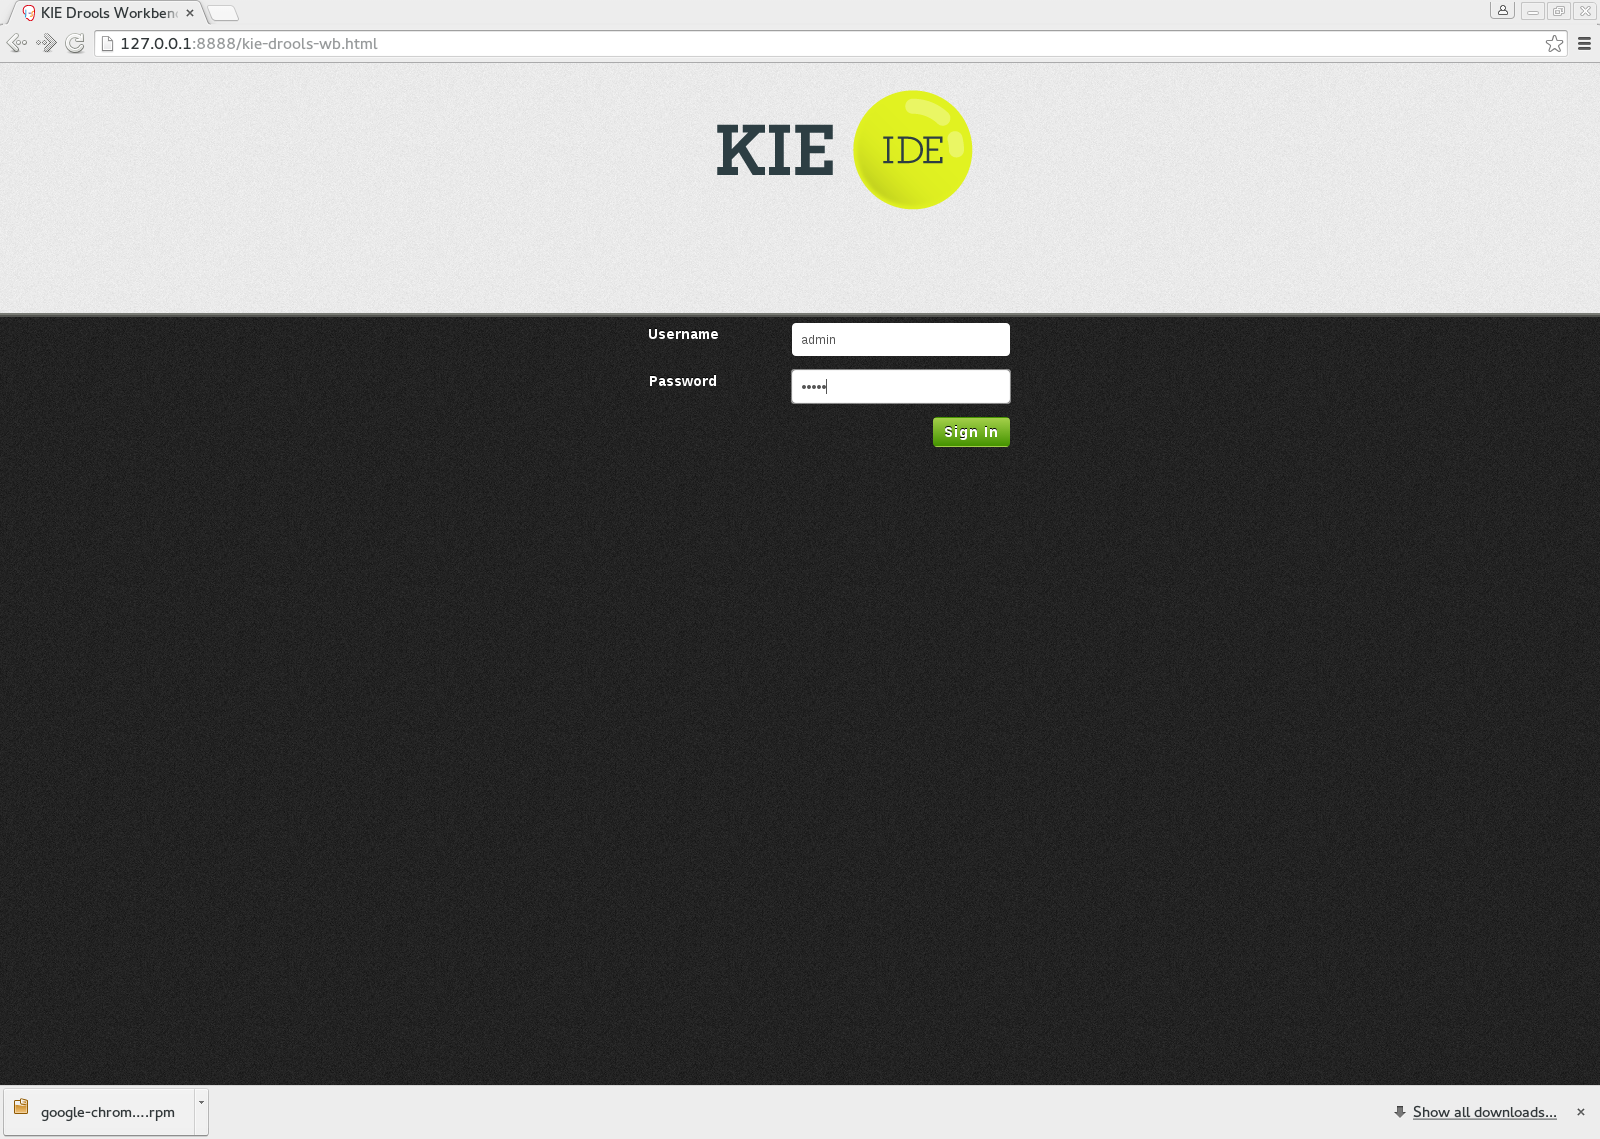
9. Press “Copy to Clipboard” button and paste the URL to Google Chrome.
10. Login as admin/admin
11. Logging in triggers GWT compile. You need to wait some time again.
12. Now you can access kie-workbench
13. Open JavaScript Console in Chrome [More Tools]->[JavaScript Console]
14. For example, Put “GuidedRuleEditorPresenter” in search box. Clicking the search result, GuidedRuleEditorPresenter.java is opened. Set a break point inside loadContent() method. Then open a Guided Rule.
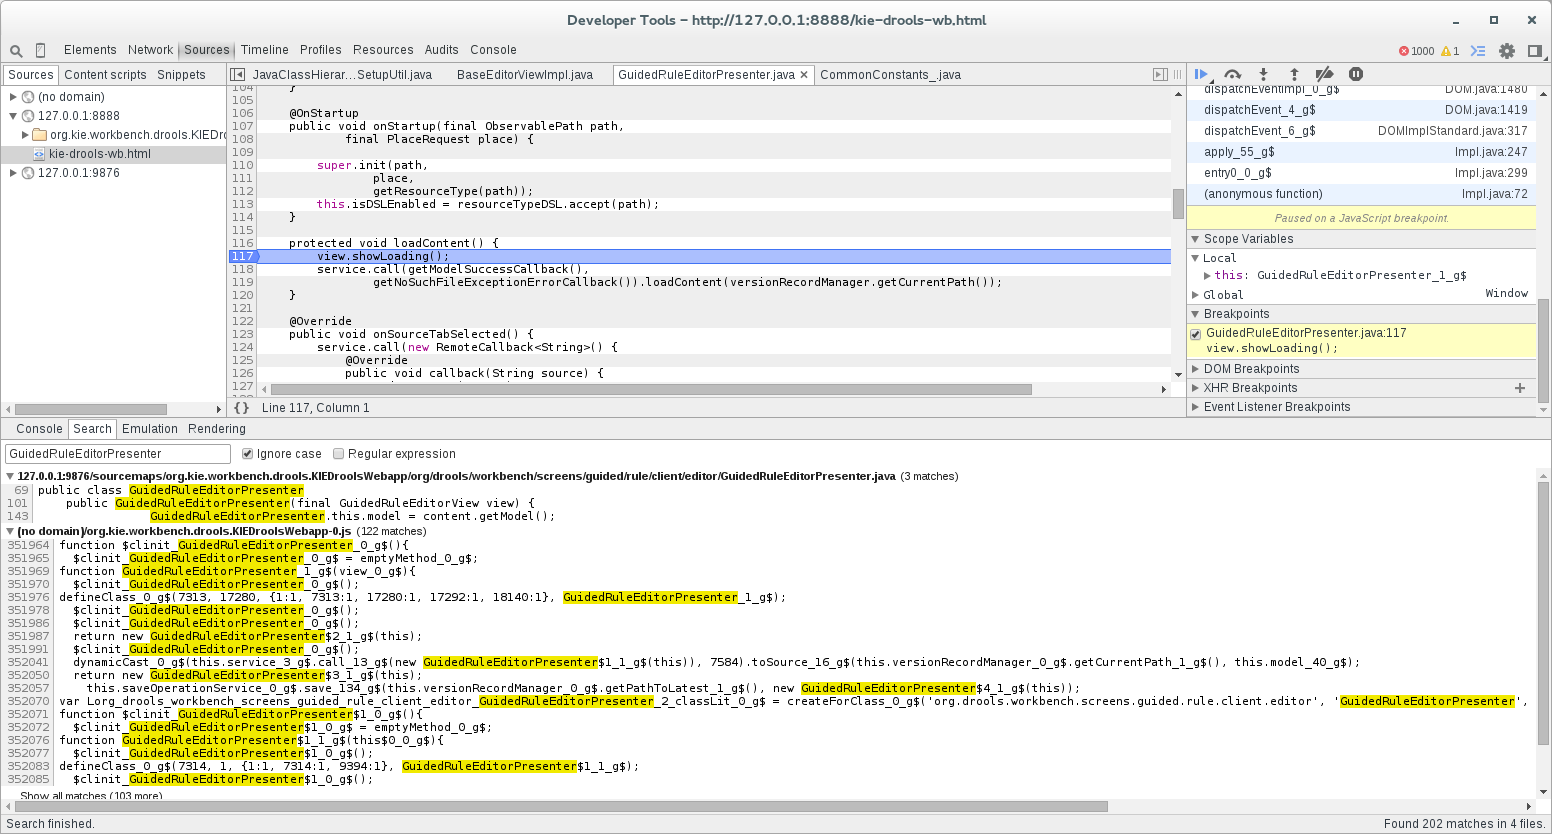
You can debug Java in browser 🙂
15. If you set a break point in a class of *.backend.* packages (e.g. GuidedRuleEditorServiceImpl), it stops in Eclipse as usual.
For more information, take a look at documents in gwtproject:
http://www.gwtproject.org/doc/latest/DevGuideCompilingAndDebugging.html
http://www.gwtproject.org/articles/superdevmode.html
2. classic DevMode
To be honest, I still prefer the old classic DevMode because I can debug client codes and backend codes in Eclipse seamlessly. But certainly the classic DevMode is outdated now so I need to get familiar with SuperDevMode.
If you still want to use classic DevMode, you have a loophole. You can dowload the old Firefox (say, 26.0) and install GWT plugin. Please note that using old version means you have lots of security issues. Make sure to use it only for local debugging.
You can enable classic DevMode with the option. I’m not sure if the option will be available in future versions. Just confirmed with GWT 2.7.0.
mvn gwt:debug -Dgwt.superDevMode=false
Following the same steps of SuperDevMode but now you can set break points in Eclipse side even for client codes.
Enjoy!

Good Morning,
I’m using Jbpm in DEBUG mode as explained on the site itself in the “Debugging kie-workbench” item. Congratulations “tkobayas” for the matter, I was very difficult with this and it worked very well … perfect. Thank you.
But this gave me another question … I’m trying to debug the Task List part and I can not get the Tasks to appear after creating a project.
I’m guessing it’s because of database access in Debug mode.
I’m trying to access the H2 anyway and I can not.
Do you have any tips on how I can do this? if it’s possible ?
Thank you.